Most software systems begin life as a conversation. “The customer places an order, support can approve a refund, and then the payment provider sends the money back.” Everyone nods. Two weeks later, five people have five slightly different systems in mind.
That gap between we talked about it and we agree on how it works is the problem UML tries to solve.
UML, or the Unified Modeling Language, gives teams a shared visual vocabulary for describing a system: what exists, how parts relate, how behavior unfolds, and where responsibilities sit. It can model code, but it can also model requirements, business concepts, deployed infrastructure, or a planned design that does not exist yet.
The keyword is language. UML is not a development process, an architecture framework, or a specific drawing application. It gives you notation and meaning. It does not tell you which meeting to schedule, how many diagrams to produce, or whether your team should use Scrum.
That distinction matters because UML earned a reputation for heavyweight documentation partly by being bundled with heavyweight processes. You can use it that way. You can also draw one focused sequence diagram in 15 minutes, put the source beside the code, and delete it when it stops being useful.
What is UML, exactly?
The Unified Modeling Language is a standardized set of graphical notations for expressing models. The Object Management Group (OMG) maintains the current UML specification, which defines the notation and the concepts behind it.
That sentence contains three terms worth separating.
- A model is a deliberate simplification of a system. It keeps facts relevant to a question and leaves other facts out.
- A diagram is one view into that model. The same model can have several diagrams for different readers or concerns.
- A language supplies elements, relationships, rules, and semantics so readers do not have to invent the meaning of every box and arrow.
Suppose we model an online order and refund system. The model may contain customers, orders, payments, refund requests, services, states, and interactions. One diagram could show what customers and support agents want from the system. Another could show messages sent during a refund. A third could show the valid lifecycle of a refund request. They are not three competing descriptions. They are three views of one subject.
This is why saying “the UML” when you mean a single image can be misleading. A diagram is not automatically a complete model, and a complete model is not automatically desirable. Good modeling is selective.
UML is not a method, tool, or process
UML does not prescribe how to gather requirements, organize a team, write code, or ship software. It does not require a particular tool. You can use UML on a whiteboard, in a canvas editor, in a modeling suite, or as text rendered by PlantUML.
It also does not guarantee good architecture. A perfectly valid class diagram can describe an awful design with impressive precision.
Think of UML like musical notation. The notation helps people describe and discuss a composition. It does not compose the music, choose the musicians, or decide when the concert happens.
The problem UML solves: too many private mental models
Software is invisible. You can walk around a building under construction and notice that a doorway is missing. You cannot walk through an authentication protocol, an object lifecycle, or a dependency graph. We compensate with names and stories, but natural language is flexible enough to hide disagreement.
“Support refunds an order” leaves basic questions unanswered:
- Does support send the refund directly to the payment gateway?
- Is eligibility checked before or after a human review?
- What happens when the gateway times out?
- Can a rejected request become approved later?
- Is a refund a property of an order or its own entity?
Prose can answer all of these questions. The trouble is that the answers become scattered across tickets, chat threads, code, and somebody’s memory. UML diagrams compress selected answers into a form people can scan and challenge.
That creates several practical benefits.
It makes ambiguity visible
When you draw a message from Support agent to Payment gateway, somebody can ask whether that connection should exist. When a state machine has no route out of Failed, the missing recovery policy becomes obvious. Drawing does not resolve uncertainty by itself; it gives uncertainty somewhere visible to land.
It supports design before code
A diagram is cheaper to change than a distributed system. Teams can compare boundaries, responsibilities, and protocols before implementation turns every decision into a migration.
It creates a reviewable reference
During implementation, a focused model can anchor API discussions, test cases, and onboarding. Later, it can help an engineer distinguish intended behavior from an accidental implementation detail—provided somebody keeps it current.
That final condition is not fine print. A stale diagram is often worse than no diagram because it looks authoritative.
How UML represents a system
UML divides diagrams into broad families. The OMG overview groups them into structure diagrams and behavior diagrams, with interaction diagrams as a specialized subset of behavior diagrams.
Structure diagrams answer questions such as:
- What parts exist?
- What types, components, packages, or deployment nodes are involved?
- How are those parts connected or nested?
Behavior diagrams answer questions such as:
- What can users or external systems do?
- How does an object or process change over time?
- What activities and decisions occur?
Interaction diagrams focus specifically on communication:
- Who sends a message?
- In what order?
- What alternatives, loops, or timing constraints matter?
This taxonomy is more useful than memorizing symbols. Before choosing a UML diagram, decide whether the question is mainly about things, change, or communication.
One order system, three useful views
Let us keep one domain running through the article: an online store where customers place orders and request refunds, support agents review them, and a payment gateway moves money.
Start outside the system: the use case view
A use case diagram shows actors and the goals they pursue through a system. It deliberately avoids internal components. That makes it useful while agreeing on scope and responsibilities with product, engineering, and domain experts.
@startuml
left to right direction
actor Customer
actor "Support agent" as Support
actor "Payment gateway" as Payment

rectangle "Online order system" {
    usecase "Place order" as PlaceOrder
    usecase "Track order" as TrackOrder
    usecase "Request refund" as RequestRefund
    usecase "Review refund" as ReviewRefund
    usecase "Process refund" as ProcessRefund
}

Customer --> PlaceOrder
Customer --> TrackOrder
Customer --> RequestRefund
Support --> ReviewRefund
ProcessRefund ..> ReviewRefund : <<extend>> [approved]
Payment --> ProcessRefund
@enduml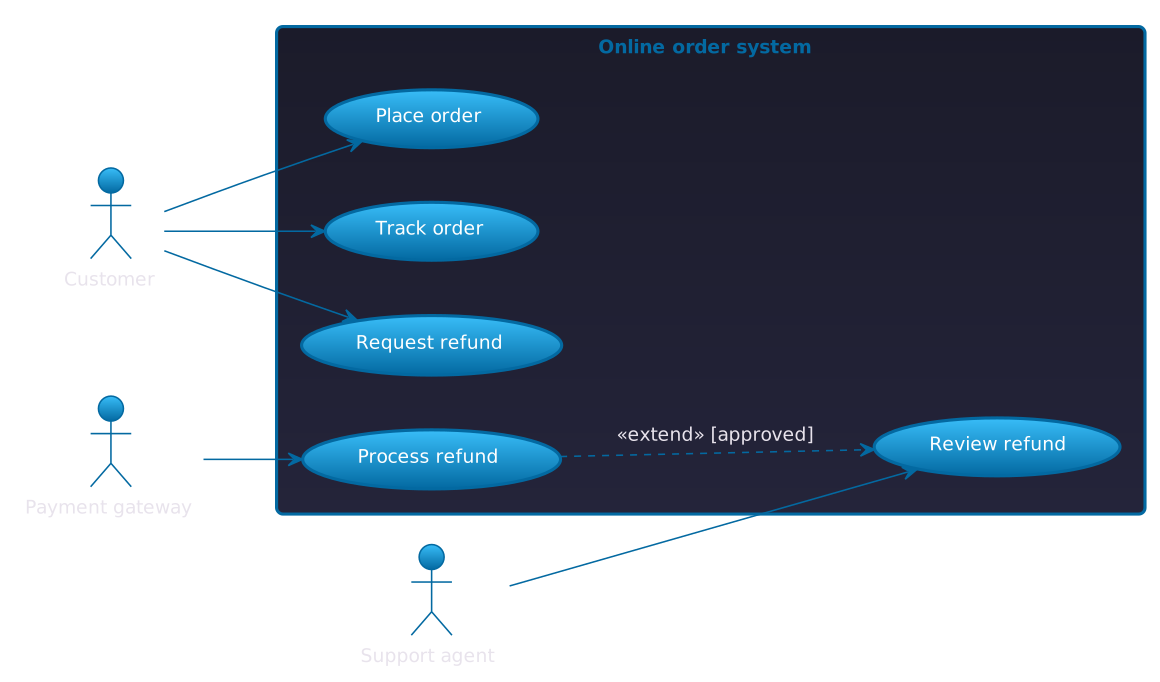
The important information is not the oval shapes. It is the boundary. The customer can request a refund, support can review one, and the external payment gateway participates in processing it. We have not decided whether this is one service or twelve. We have decided what value the system must provide and who is involved.
Use case diagrams become weak when every tiny operation is presented as a user goal. “Validate UUID” is probably implementation detail, not a use case. “Receive a refund” is closer to the actor’s intent.
Move inside: the interaction view
Once the scope is clear, a sequence diagram can expose collaboration between participants. Time runs from top to bottom; messages show who asks whom to do what.
If you want to build one yourself, the PlantUML sequence diagram tutorial covers participants, messages, activation bars, alternatives, and loops with editable examples.
@startuml
actor Customer
participant "Order service" as Orders
actor "Support agent" as Support
participant "Payment gateway" as Payment

Customer -> Orders: Request refund(orderId)
Orders -> Orders: Check refund eligibility
Orders -> Support: Ask for review
Support --> Orders: Approve refund
Orders -> Payment: Refund payment

alt refund accepted
    Payment --> Orders: Refund reference
    Orders --> Customer: Refund confirmed
else payment failure
    Payment --> Orders: Refund failed
    Orders --> Customer: Refund pending
end
@enduml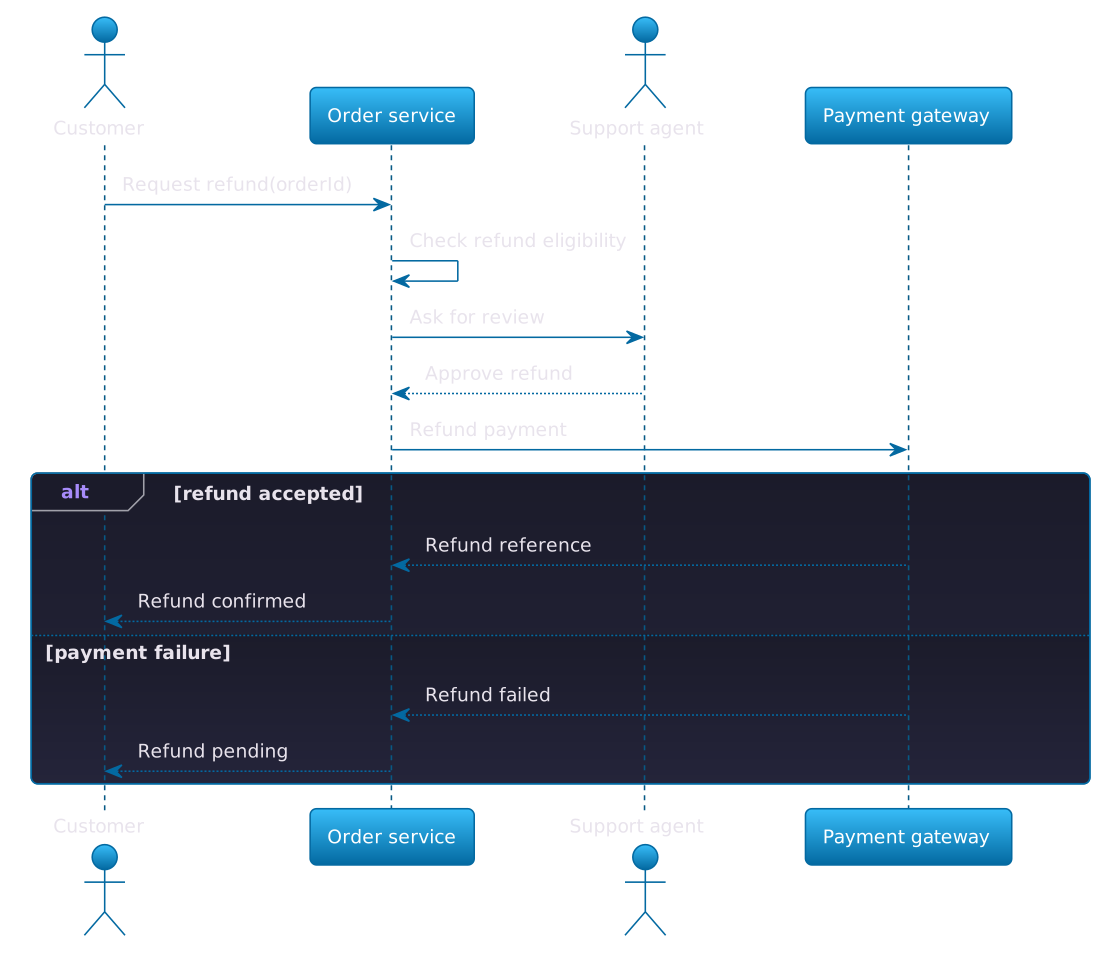
This view is useful in an API or design review because it makes ordering and ownership concrete. The order service checks eligibility before involving support. It—not the support user—calls the payment gateway. The alternative branch records that a payment failure produces a pending outcome rather than a false success.
Notice what the diagram omits: database tables, HTTP status codes, retry delays, authentication, and observability. Those may matter, but adding them all would bury the question this diagram answers.
Capture valid change: the state machine view
A refund request is not just a row with a status string. It has a lifecycle and rules about which transitions are valid. A UML state machine makes those rules explicit.
@startuml
[*] --> Submitted
Submitted --> Rejected : review rejects
Submitted --> Approved : review approves
Approved --> Processing : send to gateway
Processing --> Completed : refund succeeds
Processing --> Failed : gateway error
Failed --> Processing : retry
Failed --> Rejected : cancel
Completed --> [*]
Rejected --> [*]
@enduml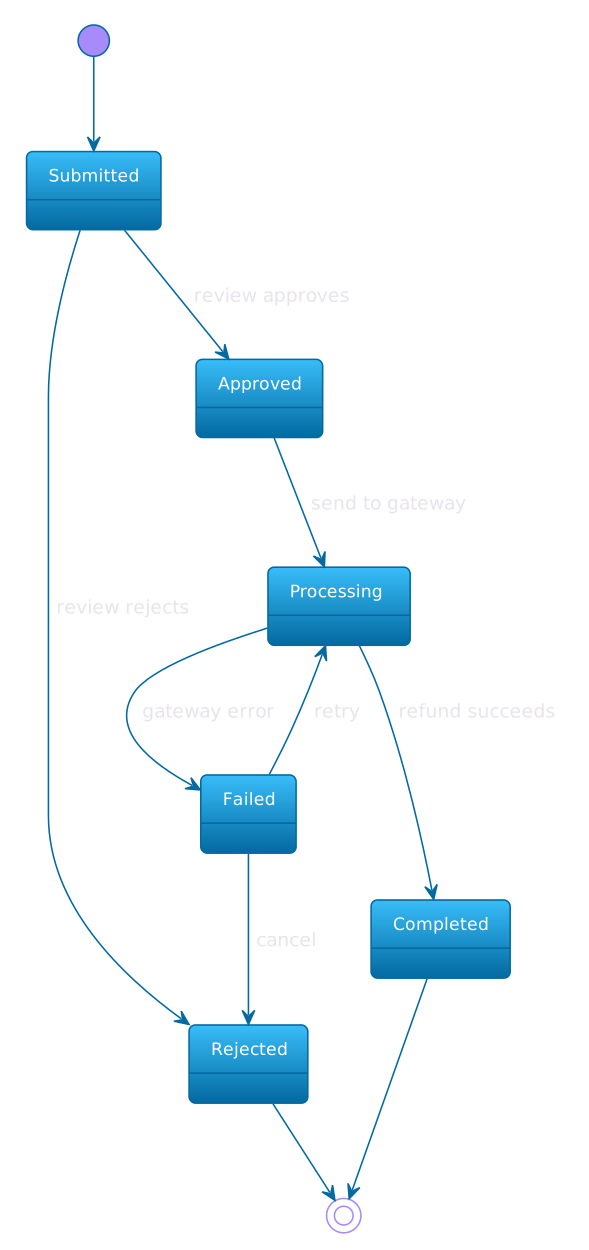
Now we can ask sharper questions. Should a failed refund be cancellable? Can a completed refund be reopened? What event triggers a retry? Each arrow is a policy decision that can become a test.
The three diagrams overlap without duplicating one another. They establish scope, explain one collaboration, and define a lifecycle without pretending to document the entire store.
The 14 UML diagram types, without the taxonomy marathon
Modern UML references commonly name 14 diagram types. There is a small historical counting trap: the older OMG UML 2.0 overview lists 13, while modern lists often count the Profile diagram separately. The number matters far less than choosing the right view.
Structure diagrams
- Class diagram — types, attributes, operations, and relationships. Useful for domain and object-oriented design.
- Object diagram — a snapshot of concrete instances and links at one moment. Useful for explaining an example configuration.
- Component diagram — replaceable software parts and their dependencies or interfaces. Useful for high-level implementation structure.
- Composite structure diagram — the internal parts, ports, and connectors of a classifier. Useful when a component’s inside matters.
- Package diagram — grouping and dependencies among packages or namespaces. Useful for codebase boundaries.
- Deployment diagram — software artifacts placed on runtime nodes. Useful for infrastructure and topology discussions.
- Profile diagram — extensions that adapt UML to a specific domain through stereotypes and constraints. Useful mainly for specialized modeling ecosystems.
Behavior diagrams
- Use case diagram — actors and the goals they achieve with a system. Useful for scope and externally visible capabilities.
- Activity diagram — actions, decisions, parallel paths, and flows. Useful for workflows and algorithms.
- State machine diagram — states and event-driven transitions. Useful for lifecycles, protocols, and reactive behavior.
Interaction diagrams
- Sequence diagram — messages between participants ordered over time. Useful for APIs, scenarios, and distributed interactions.
- Communication diagram — interactions emphasizing links between participants rather than a vertical timeline. Useful when collaboration structure matters.
- Interaction overview diagram — a high-level flow that coordinates several interactions. Useful for complex scenario orchestration.
- Timing diagram — state or value changes against a precise time axis. Useful for real-time and embedded constraints.
You do not need all 14. Many software teams get most of their value from use case, sequence, state machine, activity, class, component, and deployment diagrams. Treat the complete catalog as a toolbox, not a checklist.
A brief history: from method wars to one shared language
UML makes more sense in its historical context. In the late 1980s and early 1990s, object-oriented software development had many competing methods and notations. Different books and consultants offered different shapes, terms, and processes. A team could spend as much time translating between methods as discussing the system.
This period is often called the method wars. The name is slightly theatrical, but the interoperability problem was real: object-oriented analysis and design needed a shared notation.
At Rational Software, Grady Booch, James Rumbaugh, and Ivar Jacobson brought together ideas from their respective methods. They became known as the Three Amigos. Their unification work drew on the Booch method, Rumbaugh’s Object Modeling Technique, Jacobson’s Object-Oriented Software Engineering, and contributions from the wider modeling community.
The result evolved into UML and moved into standardization through the Object Management Group. UML did not erase every difference in software design, nor did it merge every development process. It unified a modeling language so tools and practitioners could communicate using a common semantic base. The OMG remains the steward of the UML standard.
Two earlier stories are frequently attached to UML history. Both influenced ideas later represented in UML. Neither means UML was invented for one company or one aircraft.
Statecharts, the Lavi, and reactive behavior
In 1982–83, computer scientist David Harel developed statecharts while consulting on the avionics of Israel Aircraft Industries’ Lavi fighter aircraft. In his primary account of the history of statecharts, Harel describes the need to make highly complex reactive behavior understandable without drowning in a flat explosion of states.
Classic finite-state machines become unwieldy when many states repeat similar transitions or several parts of a system operate concurrently. Statecharts added ideas such as hierarchy, orthogonality, and broadcast communication to manage that complexity. Those ideas spread through tools and methods and later influenced UML state machines.
The careful version of the story is therefore: work on Lavi avionics helped produce statecharts, and statecharts became an important ancestor of UML state machine semantics. UML itself was not invented for the fighter. UML emerged later from the unification and standardization effort.
The lesson is still relevant. State machines are not academic decoration when behavior is reactive and safety matters. They are a way to replace an informal pile of flags and callbacks with explicit, reviewable transitions.
Use cases, Ericsson, and goals from the outside
Ivar Jacobson traces the roots of use cases to his work on telecommunications switching systems at Ericsson. The core insight was to describe a system through meaningful interactions that deliver value to actors, rather than beginning with its internal decomposition. Jacobson later presented use-case ideas at OOPSLA in 1987, developed them through his methods, and brought them into the work that became UML.
Jacobson’s own history and definition of use cases emphasizes a use case as a set of ways of using a system to achieve a particular goal for a particular user. His later Use-Case 3.0 material continues that goal-oriented line.
Again, Ericsson did not invent UML. Work on switching systems supplied an important root for use-case modeling; the notation and concepts were later absorbed into the unified language.
These two roots point in complementary directions. Use cases look at the system from outside, asking what goal an actor achieves. State machines look at behavior over time, asking which changes are valid. UML unified both perspectives with structural and interaction views.
Advantages and disadvantages of UML
UML is neither obsolete bureaucracy nor a universal solution. Its value depends on scope, audience, and maintenance.
Where it shines
- A shared vocabulary reduces translation between analysts, engineers, architects, and tools
- Multiple diagram types separate structure, behavior, and interaction instead of forcing one overloaded picture
- Visual models expose missing states, unclear ownership, and hidden dependencies before they become code
- Focused diagrams improve design review, onboarding, testing conversations, and incident analysis
- A standardized notation can outlive a specific drawing application
- Diagrams-as-code make UML source diffable, reviewable, and reproducible
Where it hurts
- The notation has a real learning curve, especially beyond the common diagram types
- Large models become expensive to create, navigate, and keep synchronized with reality
- Teams can confuse formal completeness with useful communication
- Readers often interpret partially used notation differently unless the team states its conventions
- Automatic layouts may not deliver presentation-level composition
- UML is a poor fit for free-form ideation, visual storytelling, and many business-process details
The biggest disadvantage: the completeness trap
Because UML can model many aspects of a system, teams are tempted to model all of them. The result is a parallel implementation made of diagrams—expensive to build and guaranteed to drift.
A model should earn its maintenance cost. If a class diagram merely repeats every field visible in the code, IDE navigation is probably better. If a sequence diagram explains a subtle cross-service failure path, the diagram may save hours during reviews and incidents.
Where UML works well in software engineering
The best UML examples are tied to decisions and recurring questions, not documentation quotas.
Requirements and scope
Use case diagrams help a team establish system boundaries, external actors, and goals. In our store, they can reveal whether the payment gateway is an actor, whether support initiates refunds, and whether customers can cancel orders directly.
Pair the diagram with short textual scenarios and acceptance criteria. A use case oval alone does not describe validation rules, failures, or business policy.
API and distributed-system design
Sequence diagrams are excellent for protocols spanning services. They show sync versus async calls, ordering, retries, alternatives, and responsibility. During review, they can reveal circular dependencies or an actor that knows too much.
Keep each diagram centered on one scenario. “Everything the commerce platform ever does” is not a scenario.
Domain and data modeling
Class diagrams can clarify domain concepts such as Order, Payment, RefundRequest, and their relationships before those concepts harden into tables and APIs. They are particularly helpful when vocabulary is the problem.
But UML class diagrams and database schemas are not identical. A domain association does not automatically prescribe a foreign key, loading strategy, or storage technology.
Lifecycle and protocol correctness
State machine diagrams fit orders, refunds, subscriptions, jobs, devices, and other entities whose valid actions depend on current state. They make a strong basis for transition tables and tests. If production contains a transition absent from the model, either the implementation or the model needs attention.
Architecture and deployment
Component and deployment diagrams help teams discuss module boundaries, external dependencies, processes, nodes, and network placement. They can be valuable during migrations, security reviews, or incident preparation.
Use architecture-specific notation when it communicates better. UML is an option, not a loyalty program.
UML compared with nearby diagramming choices
Several tools and notations overlap with UML without being interchangeable.
UML vs flowcharts
A generic flowchart describes steps and decisions. A UML activity diagram adds standardized semantics for activities, control and object flows, partitions, forks, and joins. Use a flowchart when simple process communication is enough; use an activity diagram when UML semantics and integration with a larger model help.
UML vs BPMN
BPMN is specialized for business processes: events, tasks, gateways, messages, pools, and operational workflows. UML covers a broader software-modeling space. For a cross-department refund process involving queues, escalation timers, and business events, BPMN may communicate better. For the refund object lifecycle or service interaction, UML may fit better.
UML vs C4
The C4 model organizes software architecture views around context, containers, components, and code. It is intentionally focused and usually easier to teach for architecture communication. UML has broader and more formal notation. Use C4 when the main question is architectural zoom and boundaries; use UML when behavior, interactions, types, or deployment semantics need dedicated views. Teams can combine them.
UML vs ERD
Entity–relationship diagrams focus on data entities, attributes, and relationships, usually with a database-oriented purpose. UML class diagrams can look similar but model types, behavior, generalization, and broader domain semantics. Choose an ERD to design or explain relational data. Choose a class diagram when the conceptual or object model is the subject.
UML vs PlantUML
PlantUML is a text-to-diagram tool and language implementation that can render many UML diagram types. UML defines modeling concepts and notation; PlantUML provides a practical way to write and render diagrams. Saying “UML or PlantUML” is like saying “music or sheet-music software.” They sit at different layers.
UML vs Mermaid
Mermaid is a popular text syntax for diagrams in Markdown-oriented workflows. It supports several UML-adjacent diagrams, including sequence and class diagrams, but it is not an implementation of the complete UML standard. Use Mermaid when platform support and lightweight documentation matter most. Use PlantUML or a dedicated UML tool when broader UML coverage or semantics matter.
A practical way to start using UML
Do not begin by selecting a repository-wide modeling platform. Begin with a question.
1. Write the decision or uncertainty in one sentence
For example: “We need to agree who owns refund retries after the payment gateway fails.” If you cannot state the question, drawing will probably create decoration rather than clarity.
2. Choose the viewpoint
- Scope and user goal: use case diagram.
- Messages and ordering: sequence diagram.
- Valid lifecycle: state machine diagram.
- Workflow with branching or parallel work: activity diagram.
- Concepts and relationships: class diagram.
- Software or deployment boundaries: component or deployment diagram.
3. Draw only the happy path first
Start with the smallest readable model. Then add the one or two alternatives that materially change the design. In the refund sequence, payment failure matters. The color of a dashboard notification probably does not.
4. Review it with the people who own the facts
A diagram made alone can still encode a private mental model. Review use cases with product and domain experts, protocols with implementing teams, deployment views with platform engineers, and lifecycle rules with whoever owns the business policy.
5. Connect the model to implementation
Turn transitions into tests. Link participants to API contracts. Put the diagram source near the relevant design record or code. State what the diagram intentionally omits.
6. Give it a deletion rule
Decide when the diagram should be updated or removed. A model created for a one-time migration may be archived after completion. A model that defines a long-lived payment protocol should change in the same review as that protocol.
Keeping UML useful in a modern workflow
UML remains relevant because the underlying problems remain: distributed ownership, invisible behavior, ambiguous language, and systems too large for one person to hold in memory. What has changed is how teams expect documentation to behave.
A diagram that lives only in a slide deck is hard to discover and easy to forget. A diagram source stored as text can live with code, change in a pull request, and render automatically. Reviewers can see that Failed --> Processing : retry was added without comparing screenshots.
This is the practical advantage of diagrams-as-code in Pumler. The model stays diffable, reviewable, and close to the source it explains, while the renderer handles layout. That does not remove the need for judgment. It reduces the mechanical cost of applying that judgment repeatedly.
Common UML mistakes
Mixing abstraction levels
A diagram that places Customer, RefundController, a PostgreSQL table, and an AWS availability zone side by side probably mixes user, code, data, and deployment views. Split it by question.
Modeling implementation noise
Generated accessors, framework base classes, and every DTO field rarely belong in an explanatory class diagram. Include details that affect the decision or reader.
Optimizing for authors instead of readers
The author knows why every element exists. The reader sees a wall of boxes. Use clear titles, meaningful names, one viewpoint, and enough surrounding prose to explain the question.
Frequently asked questions about UML
What does UML stand for?
UML stands for Unified Modeling Language. “Unified” reflects its origin in bringing together several object-oriented modeling approaches. “Language” matters: UML defines notation and semantics, not a required software-development process.
What is a UML diagram used for?
A UML diagram communicates one view of a system. Teams use UML diagrams for requirements and scope, domain modeling, API interactions, workflows, state lifecycles, software components, and deployment topology. The right use is narrower than “document everything.”
Is UML only for object-oriented programming?
No. UML grew from object-oriented analysis and design, and class modeling remains important, but behavior, interaction, component, and deployment diagrams apply beyond a specific programming paradigm. A sequence diagram of services or a state machine for a device does not require an object-oriented codebase.
How many UML diagram types are there?
Modern lists commonly name 14: seven structure diagrams, three general behavior diagrams, and four interaction diagrams. Older OMG UML 2.0 material lists 13; modern counts often include Profile diagrams separately. Most teams use a practical subset.
Is UML still used in software engineering?
Yes, but often selectively. UML is useful in design reviews, systems engineering, embedded work, enterprise modeling, API documentation, and any situation where state or interaction needs precision. Many teams use only a few UML diagram types and store them as text rather than maintaining a comprehensive formal model.
Is UML the same as PlantUML?
No. UML is the standardized modeling language. PlantUML is a tool and text syntax that renders many kinds of diagrams, including UML diagrams. You can create UML without PlantUML, and PlantUML can render some diagrams that are not UML.
Do UML diagrams need to match the specification perfectly?
Not always. Informal diagrams can be effective if the audience agrees on their meaning. Precision becomes more valuable when diagrams cross team boundaries, feed tools, or describe critical behavior. If you intentionally simplify notation, state the convention rather than letting readers guess.
Which UML diagram should I learn first?
Learn the one tied to your recurring problem. For service interactions, start with sequence diagrams. For entity lifecycles, start with state machines. For requirements and scope, start with use cases. Understanding structure versus behavior is more valuable than memorizing all 14 types.
UML is useful when the model earns its keep
UML solves a stubborn software problem: people need to reason together about systems they cannot see. Its shared vocabulary turns assumptions about structure and behavior into artifacts that can be inspected, challenged, and revised.
The language is broad because software questions are broad. Use cases look from the outside. Sequence diagrams follow collaboration. State machines define valid change. Structural diagrams map the things involved. You rarely need all of them, and you almost never need all details in one place.
The honest trade-off is maintenance. UML helps when a focused model reduces ambiguity or risk more than it costs to keep current. It hurts when completeness becomes a goal, notation replaces conversation, or diagrams drift away from code and operations.
Start with one real question, one audience, and one diagram. Keep the source reviewable. Let automatic layout handle the pixels. Delete models that no longer earn attention.
That is less grand than modeling the entire enterprise. It is also much more likely to help the next engineer understand why a refund can be retried—and why it cannot jump straight from submitted to completed.